Is Your Child Falling Behind? How We Measure Where They Really Stand
May 7, 2022
What is a Percentile Score?
In many of the tests we, and others, use to establish areas of relative strength and weaknesses, the results are presented as percentile scores.

What is a percentile score? For those who have children and have gone through the process of taking them to the pediatrician, you will be somewhat familiar with this. You may have heard something along the lines of ‘your little girl is at the 58th percentile for height and 37th for weight.’
The same thing is happening when we discuss test results as a percentile.
How to Find a Chronological Age
Let’s pretend we are talking about a student who was born on July 11th, 2005. Let’s also pretend it is now September 26th 2016. To find their chronological age you would subtract their birth date from the current date.
So
2016 – 9 – 26
2005 – 7 – 11
11 – 2 – 15 is how old they are. So they are 15 days into the 3rd month of being 11 years old.
Many tests create 6 months groupings of children. Using the example above, that student would fall into the category that spans
11 years – 0 months and 0 days through 11 years – 5 months and 29 days.
So a 6 month bracket that would more or less be your peer group. In some scenarios the age range is wider however you are still being compared against children relatively close to you in age.
Performance Relative to Their Peers
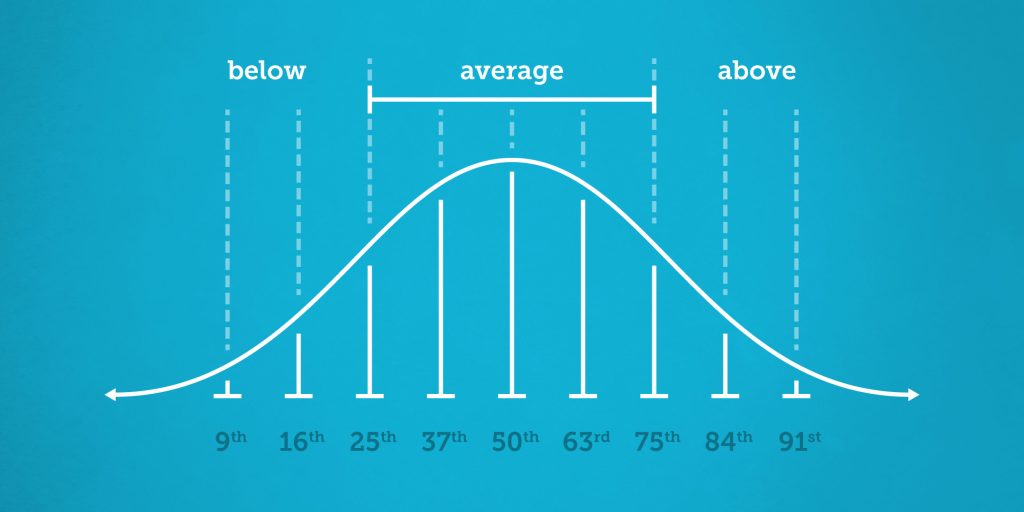
Let’s imagine 1000 children who fall within that age range are evaluated using a certain test.

Whatever outcomes are arrived at most frequently will be the high point on the curve at the 50th percentile. Any score that is stronger would slide to the right on the curve at various intervals up to the 99th percentile. Any score that is weaker will slide to the left on the curve at the same intervals.
The average range, the range that reflects that skills are developed to a level where they can function with a level of automaticity, is 25th-75th.
The further you drop below the 25th percentile, the more likely it is that whatever is being measured will not function in the way you would want and need it to.
Below, Average and Above
Why do we Look for a Certain Level of Ability
We don’t exist to create students who are Shakespearen when they write or mini Einsteins when they do math. What we do want is for students to be able to interact with their class work without feeling like the cards are stacked against them. That when they put in work they see outcomes on par with the efforts they put in. That they feel successful.
In order to see that, you require a certain level of automaticity in the skill. Not every student will see that at the 37th percentile and above, but most do. When you see skills below the 37th percentile, and on intake our students are all well below the 37th percentile, you may see no ability in the area being measured at all. You may see some ability but the skill is very inefficient. This will lead to students trying to get the work done, through a huge effort, with poor outcomes, both in the work and emotionally.
Short version on percentiles: if you score at the 25 percentile, roughly 75 percent, or 75 out of a hundred students roughly the same age as you, are able to do the work at a higher level than you were.
If you score at the 1st percentile, 99 percent of children in your peer group are stronger in that area than you are.
Take a look back at our student’s profile to see the difference between her intake (in red) and her exit (in blue) percentile scores.
Percentile scores tell us where a child stands; language-based learning difficulties are the most common reason those scores sit below the average range. If you’d like to know where your child stands — and what can be done about it — visit our Contact Page, call +1 (902) 425-7323, or email info@novaread.com to book an intake consultation at our Halifax or Bedford clinic.
Questions Parents Ask
What does a percentile score actually tell me about my child?
It compares your child with other children the same age. A score at the 30th percentile means that out of 100 same-age children, 70 scored higher. It is not a mark out of 100 — it is a snapshot of where your child stands among their peers.
What do “below average,” “average,” and “above average” mean on these tests?
Test results group children into ranges. We pay close attention to any core skill that lands below the average range, because those are the skills that make classroom life hard — and the ones remediation is designed to rebuild.
Does Novaread try to turn every child into a top scorer?
No. Our goal is for your child to handle the reading, writing, and math their classroom asks of them — comfortably and independently. The testing exists to find exactly which skills are holding them back, so the work targets only what needs fixing.